


Find a Bird
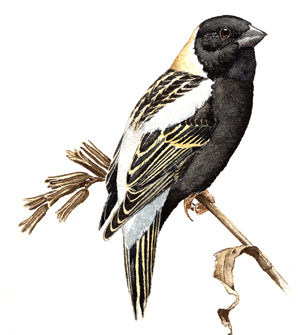
Bobolink
Dolichonyx oryzivorus
Fairly widespread and likely increasing

“Merrily swinging on brier and weed, / Near to the nest of his little dame, / Over the mountain-side or mead, / Robert of Lincoln is telling his name.” – William Cullen Bryant, “Robert of Lincoln”
Old Robert of Lincoln – or, as it is better known, the Bobolink – sings his name across meadows, hayfields, and pastures throughout much of the northern United States and southern Canada. This handsome blackbird has periodically clashed with humanity in Massachusetts during the past few centuries. Its numbers were once precariously low, and it continues to decline precipitously in some parts of its range. The Bobolink was even recently listed as a Threatened Species in Canada due to habitat loss and degradation caused by agricultural intensification. If the latest chapter in the Bobolink’s story proves nothing else, it illustrates that humans are in fact capable of helping a declining species once its natural history is well understood.
Historic Status
Because of their rice thievery in the Southern states, Bobolinks were originally known as Rice Buntings when Massachusetts birdlife chroniclers first began their work in the 1830s. Throughout the Bay State’s agricultural heyday, when fields abounded, Bobolinks, or Skunk Blackbirds, were abundant, even though their numbers began to drop during the last quarter of the nineteenth century. Although it seems logical to think that they were being shot to protect the vast rice fields in the south, Edward Howe Forbush surmised they were actually an economically desirable food product in their own right. Following a trip to Georgetown, South Carolina, in September 1912, Forbush stated, “It became evident to me that the Bobolinks were not killed to protect the rice at that time as most of the rice was already cut” (Forbush 1927). While logic would suggest that Bobolinks would decline with the loss of grassland to reforestation during the twentieth century, they appeared to maintain their population as the years of the fieldwork for Atlas 1 approached.
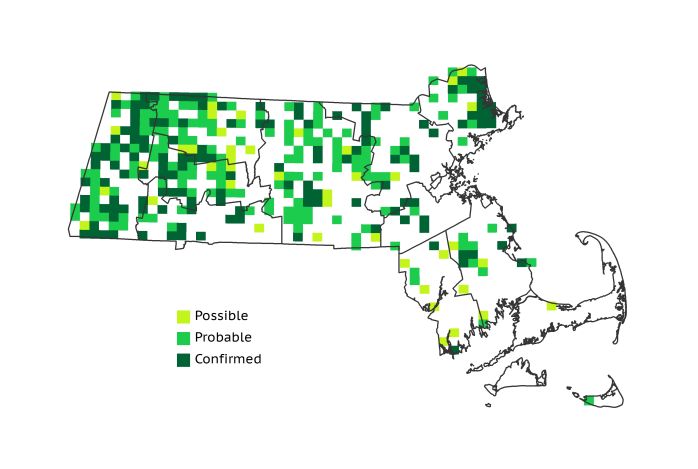
Atlas 1 Distribution
Atlas 1 determined that the once-widespread Bobolink was still an established breeder, and volunteers found them in 35% of the surveyed blocks. The Marble Valleys, Berkshire Highlands, and surrounding regions still supported a generous concentration of breeders. The Connecticut River Valley, where by all rights Bobolinks should have been widespread, reported them from 46% of all blocks. Early haying of the fields where Bobolinks were nesting may have been partially to blame for this lower occupancy rate. The Worcester Plateau regions had occupancy rates near 40%. They were more sparse east of there, and were local breeders in the Coastal Plains wherever fields or wet meadows were maintained in usable condition. In the Boston Basin and Cape and Islands, they were scarce. The Bristol/Narragansett Lowlands had a few localized concentrations of breeding Bobolinks but their presence on the Cape and Islands was limited to the open heathlands of Nantucket.
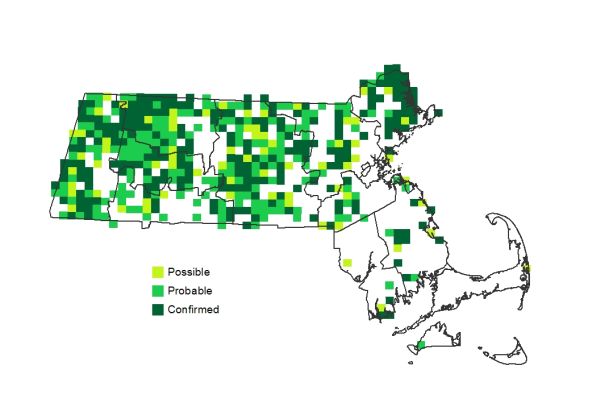
Atlas 2 Distribution and Change
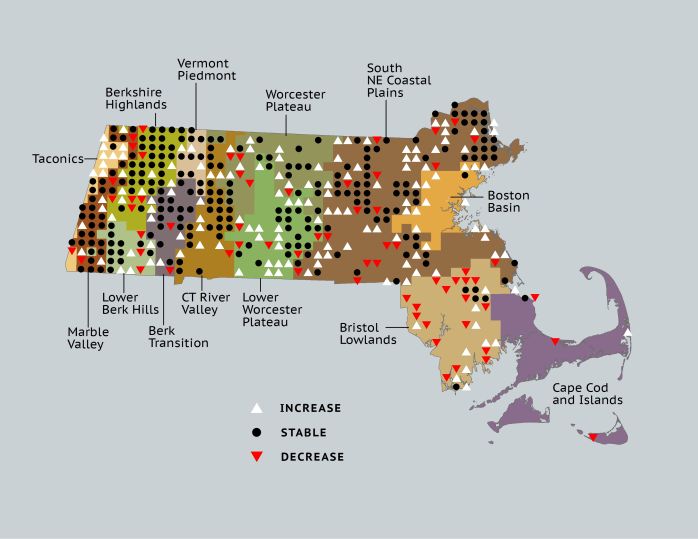
By the time of Atlas 2 the range of the Bobolink in the state closely paralleled the agricultural footprint of hay production in the Commonwealth, and Robert of Lincoln had increased his footprint to 45% of the blocks surveyed. Unlike many nearby states, the Bobolink’s range was increasing in Massachusetts, and all regions showed a net gain of occupied blocks with only two exceptions. The Bristol Lowlands had notable losses, and in the Cape and Islands block occupancy rates remained extremely low. As with many other expanding species in the state, the increasing footprint of this species featured considerable stability, especially in the far west, the Coastal Plains (notably Essex County). This persistence was augmented by growth, and while there is evidence of loss the overall footprint of the Bobolink was growing at the time of Atlas 2.
Atlas 1 Map
Atlas 2 Map
Atlas Change Map
Ecoregion Data
Atlas 1 | Atlas 2 | Change | ||||||
Ecoregion | # Blocks | % Blocks | % of Range | # Blocks | % Blocks | % of Range | Change in # Blocks | Change in % Blocks |
Taconic Mountains | 5 | 31.3 | 1.5 | 14 | 56.0 | 3.0 | 8 | 53.3 |
Marble Valleys/Housatonic Valley | 34 | 87.2 | 10.2 | 35 | 89.7 | 7.4 | 1 | 2.6 |
Berkshire Highlands | 37 | 67.3 | 11.1 | 43 | 78.2 | 9.1 | 5 | 9.4 |
Lower Berkshire Hills | 15 | 53.6 | 4.5 | 18 | 58.1 | 3.8 | 2 | 7.4 |
Vermont Piedmont | 13 | 76.5 | 3.9 | 17 | 100.0 | 3.6 | 2 | 16.7 |
Berkshire Transition | 23 | 60.5 | 6.9 | 27 | 67.5 | 5.7 | 4 | 12.9 |
Connecticut River Valley | 26 | 46.4 | 7.8 | 38 | 58.5 | 8.1 | 7 | 14.6 |
Worcester Plateau | 33 | 42.3 | 9.9 | 57 | 64.8 | 12.1 | 11 | 22.9 |
Lower Worcester Plateau | 28 | 37.8 | 8.4 | 48 | 60.0 | 10.2 | 10 | 18.5 |
S. New England Coastal Plains and Hills | 92 | 34.1 | 27.5 | 142 | 50.2 | 30.1 | 30 | 13.3 |
Boston Basin | 1 | 1.8 | 0.3 | 13 | 23.2 | 2.8 | 11 | 20.0 |
Bristol and Narragansett Lowlands | 23 | 21.7 | 6.9 | 15 | 13.2 | 3.2 | -8 | -7.9 |
Cape Cod and Islands | 4 | 2.9 | 1.2 | 4 | 2.8 | 0.8 | -1 | -0.8 |
Statewide Total | 334 | 34.5 | 100.0 | 471 | 45.4 | 100.0 | 82 | 9.9 |
Notes
The Bobolink shows a significant decreasing Breeding Bird Survey trend in the New England/Mid-Atlantic Region and in the Eastern US overall. While Bobolinks are often found nesting on private hayfields, there are many locations around the state where farm fields and old hayfields are maintained as part of town open space plans. It is possible that the growth of this type of land parcel and land preservation have been able to offset losses for this species, especially in areas where agricultural lands are being converted to residential and other uses. The timing of hay cutting in all Bobolink nesting sites is of concern for both the farmers and the birds, and research to optimize the economic value of the crops and the maximum production of the birds is desirable.